-
Mail us
sale@tiger-transformer.com -
Phone us
(+86)15155183777 -


Mail us
sale@tiger-transformer.comPhone us
(+86)15155183777
Introduction
Although battery electric vehicles (BEVs) currently account for a relatively small share of the overall market[1], it is expected that in the next 5 to 10 years, Battery electric vehicles (BEVs) will start to replace conventional powertrains and dominate the market after 2040 [2]. However, to achieve this goal, manufacturers face many challenges, not only needing to build facilities suitable for pure electric vehicles on a large scale, but also to seize market share in a rapidly growing and changing environment.
Many studies and surveys have shown that the top three barriers preventing consumers from entering the market are cost, "range anxiety" and concerns related to charging and related infrastructure [1] [2] [3]. To capture market share, manufacturers must develop product strategies that address these issues, offering more cost-effective solutions while delivering pure electric vehicles that meet consumers' growing range demands.
The cost of the battery is not to be underestimated (representing a huge change in the relative Bringing huge cost benefits. However, due to the prevalence of "range anxiety", guaranteeing satisfactory vehicle range can backfire. Therefore, understanding how to efficiently utilize battery capacity while still meeting operating range targets is one of the imperatives for a robust product strategy. In this context, we need to take a more holistic view of power cost optimization, as traditional component-centric cost engineering can actually be detrimental. Removing a cost from one component increases the cost of another. For example, choosing a high energy density motor can reduce motor cost, but the need for higher current may increase the cost of the frequency converter.
In order to do this effectively, we need to carefully consider each power subsystem [5]. As shown in Figure 1, reducing the size of components in each subsystem, inverter, motor and transmission, and battery can save costs. Improving the efficiency of these subsystems can also reduce the required battery capacity for a given range, further increasing the potential for cost reduction. Or, increase your product's competitive advantage by increasing vehicle mileage.
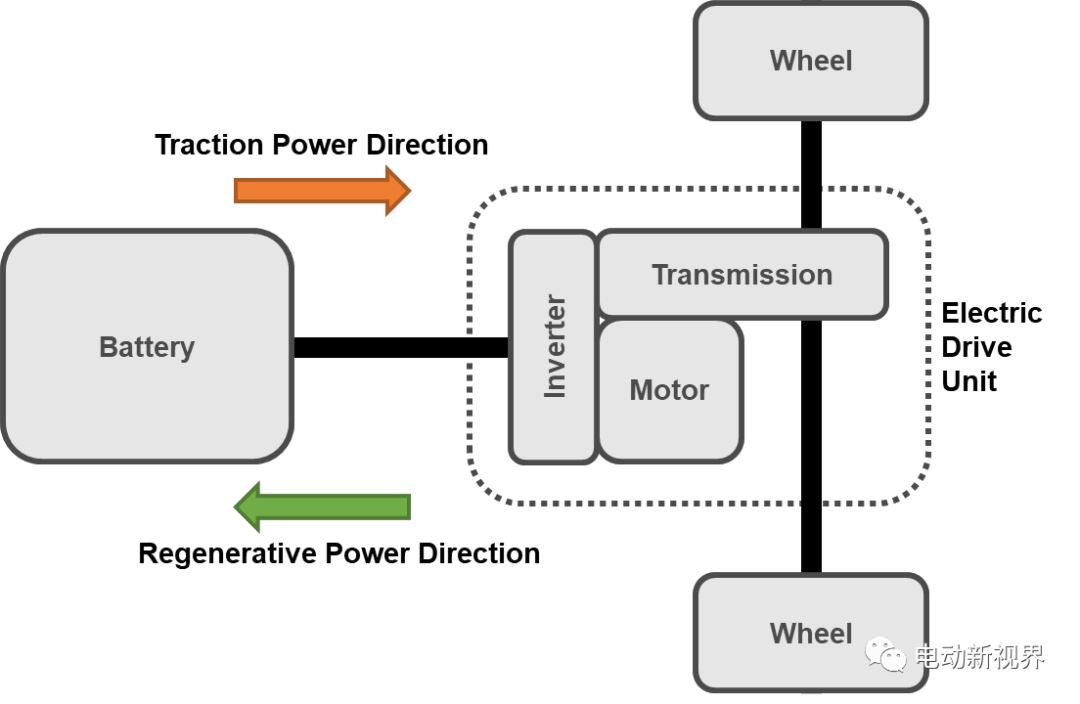
Figure 1 - Schematic Diagram of Electrified Powertrain
Traditional tools and processes for designing and optimizing powertrains are not necessarily suitable for the increasingly complex interactions of subsystems or meeting the changing needs of the industry. This can make developing a conceptual architecture time-consuming, fragmented, and overly dependent on subjective viewpoints, or biased toward "known solutions." Therefore, it will become very difficult to objectively determine the answers to the questions of "the best combination of components for a certain model" and "the content of a long-term electrification product strategy".
Answering such questions requires a thoughtful, systematic approach, and it is this philosophy that drove the development of the Drive System Design (DSD) tool. A key enabler of the ePOP process is the unique design of subsystems and components that allows the process to build complete dynamic variants for simulation.
ePOP quickly generates a range of viable power candidates for a variety of topologies and layout designs. ePOP quickly generates input data including component and subsystem dimensions, masses, and efficiency maps, allowing thousands of unique powertrain combinations to be simulated and compared through intelligent cost functions and trade-off algorithms. This enables a trade-off assessment of cost and efficiency (or vehicle range), both of which are critical to the future development of electric vehicles.
These issues are interrelated and are addressed by looking at optimizing electrified powertrains and electric vehicles as a whole. For example, "range anxiety" can be easily solved by using a high-capacity battery pack. However, considering a typical battery cost of around $280/kWh as calculated by the UK Advanced Propulsion Center [2] in 2017, addressing this as a single issue could lead to cost increases as batteries account for The proportion of the total cost can be as high as 75% [4]. Therefore, it is obviously inappropriate to approach the problem in this way. The optimization of power cost and efficiency must be carried out simultaneously with the optimization of the whole vehicle. This may come in the form of minimizing battery capacity and subsequent cost, or maximizing vehicle range on a given vehicle platform. These measures all address concerns about the premium market for pure electric vehicles. However, in order to create a sound product strategy, the potential cost fluctuations of key cost factors must also be fully considered.
An example of the expected cost trajectory published by the Advanced Drive R&D Center is shown in Figure 2. Manufacturers should consider potential future material cost trends when developing products, while being prepared to manage the risk of unsuccessful cost reductions.
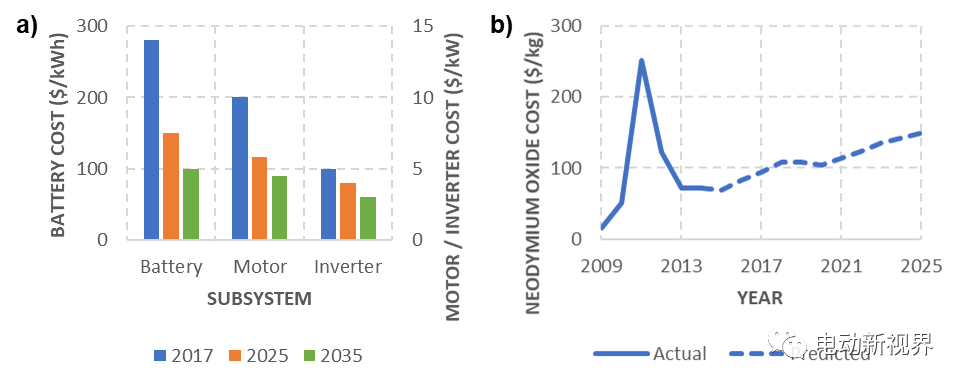
Figure 2 - Cost of Electrified Power Subsystems and Materials Trends; a) cost projections for UK advanced drive R&D centers [2], b) neodymium oxide cost, 2009 - 2025 [6]
Figure 2b shows how the price of neodymium has soared in 2011 (Neodymium is the main material in many automotive engine components) [6]. A robust product strategy takes into account the potential impact of these cost fluctuations and the potential value of other costs, as well as their relative benefits to the system. For example, a product design that utilizes higher grade rare earth magnets, while taking into account the impact of material cost fluctuations, may also reduce inverter current requirements and create a more efficient system. In turn, this reduces battery capacity and further improves cost efficiency. This article will demonstrate the value of ePOP's approach in providing data to engineers so they can have an informed view of trade-off studies when choosing a concept strategy.
Subsystem Model
A key feature of the ePOP process is the ability to quickly and accurately model subsystems and The input data is created by the body and customized according to the needs of the application [7]. This process generates for each subsystem a unique characteristic necessary to simulate the vehicle and the cost function.
Transmission Model
The transmission subsystem modeling program is capable of generating input data for any characteristic transmission architecture. Using a modular approach, the transmission is broken down into a parallel shaft system and a planetary gear set supported by shafts, bearings and necessary bushings. Each is sized for the required torque and ratio, allowing representative mass and power losses to be determined and then an efficiency map to be generated. Multi-speed transmission units can also be added by adding clutches etc. to the system, dimensioning them in a similar way.
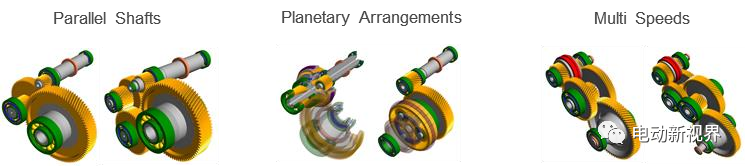
Figure 3 - A series of transmission system devices that can be added
Figure 4 shows the power loss at a single operating point for two variable speed architectures. Three-stage parallel shaft transmissions cost more and have greater power losses than two-stage transmissions. However, the causes of power loss due to low mesh ratios of individual gears also vary. Finally, the three-stage design enables a higher overall gear ratio, which in turn makes smaller, high-speed, low-torque motors feasible.
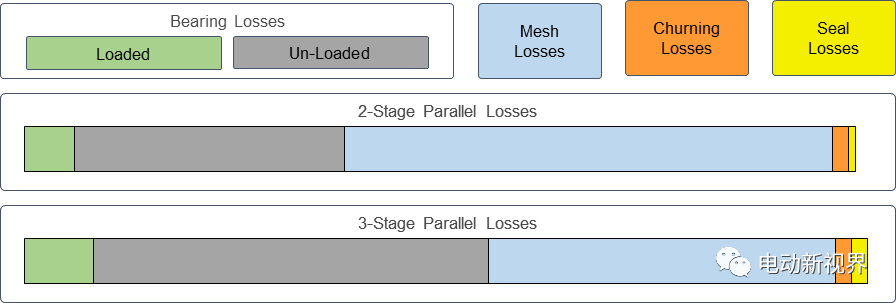
Figure 4 - Two transmissions for a given operating point Example of Power Loss in Design
Motor Model
The motor model was generated by an internally developed subroutine in Python that calls Motor-CAD and Automatically parameterize models to generate efficiency maps, material masses and inertias. As shown in Figure 5, the motor generation program is able to utilize the appropriate Motor-CAD module to generate a variety of motor design types, including permanent magnet synchronous motors (PMSM) with multi-rotor topologies [Surface Magnet (SPM) and Embedded Permanent Magnet (IPM)], induction motors and switched reluctance motors (SRM).
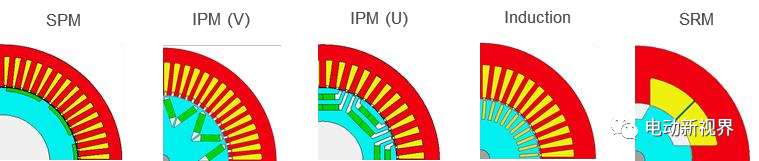
Figure 5 - A range of different motor types can be used and topology
The program receives topology requirements from other targets, such as peak or continuous torque or power. Next, the program selects the appropriate base geometry to meet the goals within thermal and structural constraints, and iterates through multiple variables to generate a range of feasible designs that meet the required specifications. Once a Motor-CAD model has been generated, mass and power consumption can be determined accordingly.
Figure 6 shows examples of losses at a single operating point for permanent magnet and induction motors. As expected, reducing copper and iron losses offsets magnet losses, which makes permanent magnet motors more efficient. However, induction motors may be less costly due to the missing magnet content, but without a complete systems approach, it is not clear whether this less expensive motor option would thus be outweighed by the impact on the system.
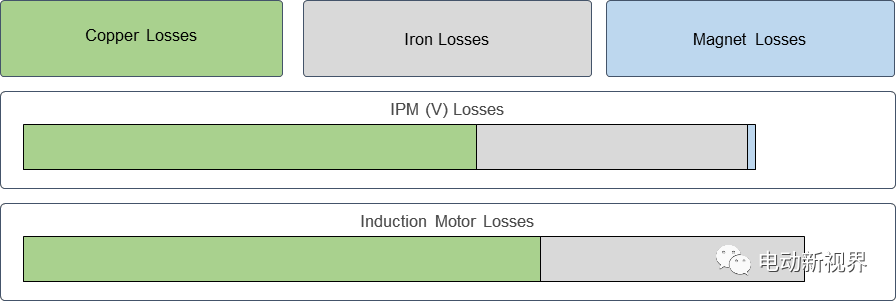
Figure 6 - Two motors with a given operating point Example of Power Loss in Design
Frequency Converter Model
Two major frequency converter technologies currently being considered for use are the traditional Insulated Gate Bipolar Transistor (IGBT) and the recently developed Silicon Carbide (SiC) Metal Oxide Semiconductor Field Effect Transistor (MOSFET). Using a custom drive model developed and validated by DSD, ePOP calculates drive efficiency maps, mass and cost, all of which are necessary input data for the optimization process.
Figure 7 shows an example of losses for IGBT and SiC inverters. By reducing gate losses and eliminating diode switching losses, SiC inverters can be found to be more efficient than standard IGBTs. However, this benefit comes at an additional cost. This additional added cost leaves the user with a trade-off: when would a SiC inverter be a viable solution for a given application, and what could be done with the rest of the powertrain to enable this decision?
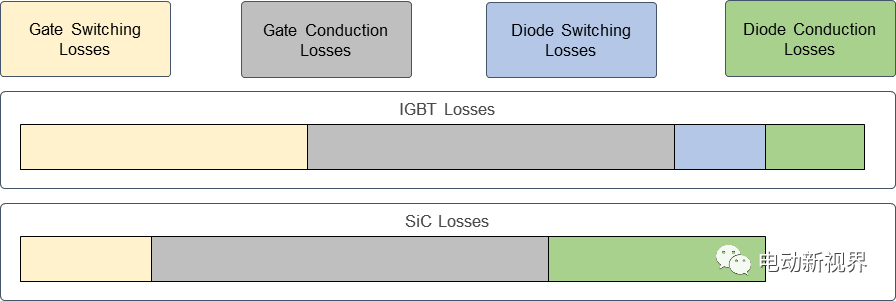
Figure 7 - IGBT and SiC inverter at a given Example of Loss Analysis at Working Point
Vehicle Model
Based on the Matlab/Simulink vehicle model, the backward model is used to simulate the vehicle cycle conditions, and the Forward model for performance simulation. The backward facing vehicle model takes into account vehicle and component inertia, rolling resistance, aerodynamic drag, gradient and efficiency maps to calculate operating conditions and vehicle cycle energy consumption.
Vehicle models directly relate subsystem performance to vehicle attributes, such as acceleration, top speed, or vehicle cycle efficiency, and allow the operating conditions of different systems to be evaluated and compared in a fair comparison. This allows users to identify trends leading to quantifiable performance benefits.
Simulate multi-speed transmissions using an idealized approach to provide the fairest comparison of drivetrain architectures and avoid the effects of predefined control strategies. Therefore, during each vehicle cycle, the vehicle operates in the optimum gear every time. Shift energy consumption is calculated during post-processing in order to take into account all energy losses/regeneration, while also taking into account shift efficiency.
System Cost
A cost function is derived based on material cost calculations for each powertrain subsystem for each subsystem architecture involved An accurate estimate was made. Additional cost and weight may be added based on exceeding or not meeting weight and/or performance targets, or penalties for incurring NVH-related risks or exceeding a given package volume or shape.
One of the key factors in the cost of electric vehicles is the battery. In the cost function, the process compares the vehicle range determined by a given battery capacity and vehicle cycle energy consumption, and compares it to the target range for the vehicle or application. Each powertrain then receives a cost penalty or cost reduction proportional to the realized mileage shortfall or surplus. The fines are determined based on the cost per kilometer traveled, using the estimated cost of the battery, as shown previously in APC Figure 2. This method allows the user to quantify the benefits of investing in powertrain efficiency.
Case Study
In order to understand the benefits of the systems approach described above, we will define a vehicle case study and explore the potential design space of an electrified powertrain. This study aims to identify a range of alternative solutions for powertrains and their subsystems, and how several application-specific tradeoffs can be made to determine the best solution to meet energy consumption and cost targets.
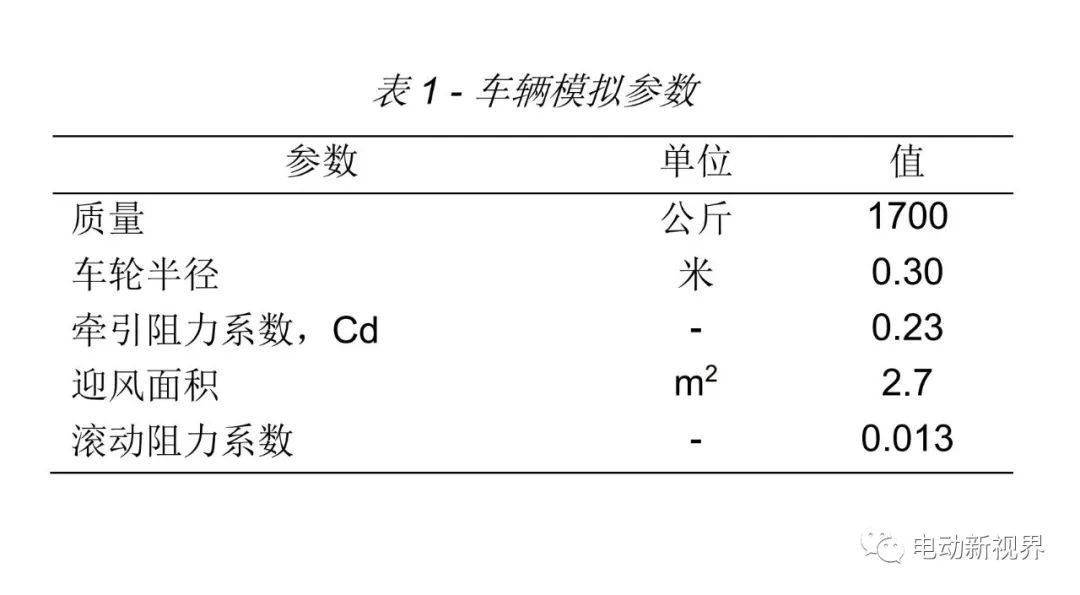
For this example, an all-electric four-door sedan was selected and market-typical performance indicators were set; a minimum top speed of 160 km/h and a 0-100 acceleration in 7.5 seconds or less km/h with a fixed battery capacity of 100 kWh. Typical vehicle simulation parameters for other applications are shown in Table 1.
Table 1 - Vehicle Simulation Parameters
We will examine a range of other alternative powertrain options, taking into account changes to the main subsystems, frequency converter, motor and transmission. For the motor, we considered two internal permanent magnet topologies, "V" and "U", as well as an induction motor. Each motor has a peak power between 170 and 200 kilowatts and varies in the number of poles and phase currents. Each motor is paired with an IGBT or inverter-based SiC MOSFET. Finally, each motor-drive combination was matched with three alternative transmissions. To reduce the complexity of this case study, we only consider parallel shaft configurations and are limited to single or two speed transmissions. A single-speed transmission consists of two or three gears, while a two-speed is limited to two gears. In order to evaluate the optimal configuration for energy consumption and cost, we simulated a large number of different operating conditions with large variations in the ratio of each gear meshing.
Results
Every powertrain that met the constraints set by the case study vehicle performance standards was analyzed at WLTC, totaling more than 17,500 feasible solution. The resulting energy consumption and power costs for each potential variant are shown in Figure 8, where a large number of unique powertrains analyzed can be seen. Figure 8a shows the powertrain independent of the energy storage device, while Figure 8b considers the combined impact of battery costs as part of the overall powertrain cost.
The two distinct clusters in Figure 8 represent the two inverter types analyzed in this study, SiC inverters in orange and IGBT inverters in blue. We see two expected features: SiC inverters consume less energy due to reduced switching and diode losses, but the cost of using this new technology is higher. However, as shown in Figure 8b, the relative system cost difference between the two VFD options becomes significantly smaller once the effect of battery cost is accounted for, suggesting that battery cost for the rest of the powertrain is the dominant factor.
The difference in energy consumption for each simulated variable requires further attention. Many Tier 1 suppliers and vehicle manufacturers either utilize SiC inverters or use them to improve efficiency. However, the difference between the best and worst IGBT systems is much greater than the gain from switching to SiC inverters, highlighting the potential benefits of system-level analysis at the concept stage.
Fig. 9 presents the same data set as Fig. 8, but analyzes the effect of other transmission designs considered; two- and three-stage single-speed and two-stage two-speed, all based on parallel shaft gears. For simpler single-speed configurations, we can see a reduction in the number of gear meshes and bearings and their associated losses, reducing energy consumption across the vehicle cycle.
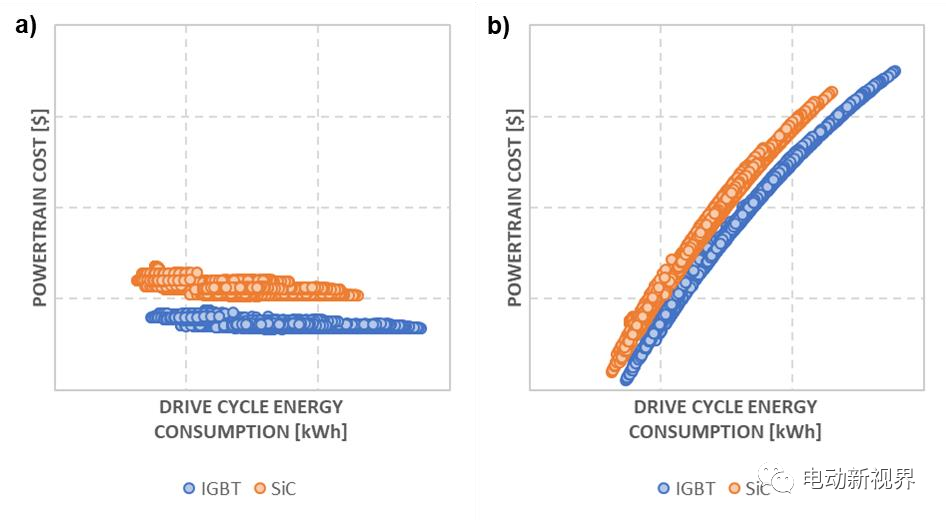
Figure 8 - Energy consumption and possible Select the power cost of the inverter design; a) power system cost only, b) power cost including current battery cost
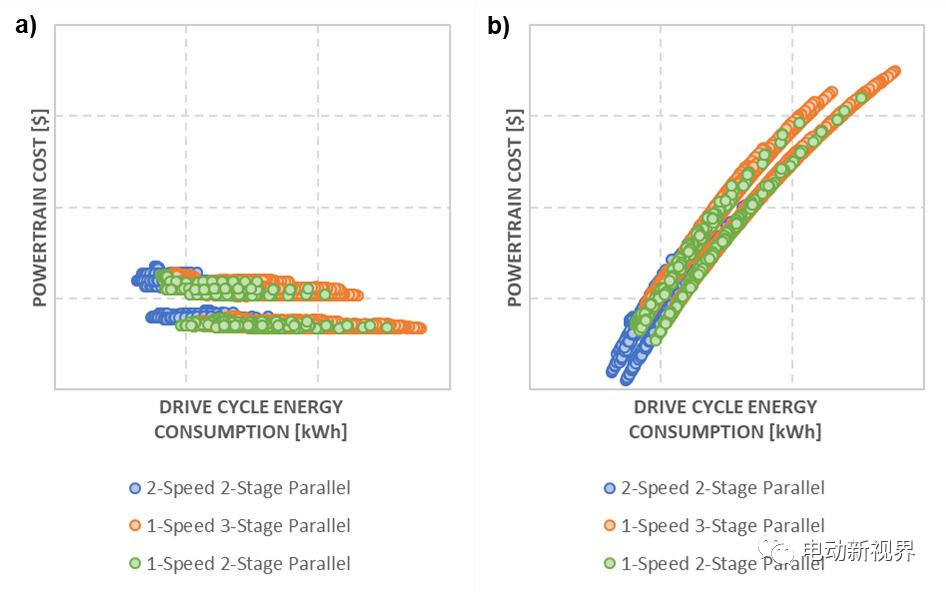
Figure 9 - Vehicle Cycle Energy Consumption vs. Powertrain Cost for Optional Transmission Design a) Powertrain Cost Only, b) Powertrain Cost Including Current Batteries Cost
However, two-speed transmissions consume less energy in both single-speed configurations. The two-speed transmission enables more efficient use of the powertrain's peak efficiency zone, making it easier to shift gears when efficiency drops. This reduces energy consumption and narrows the difference between the most and least efficient powertrains. As with the choice of frequency converter above, this performance improvement comes at a higher cost. In this case, choosing a different two-speed transmission would not only result in additional costs associated with the additional rotary member, but also in the shifting mechanism and subsequent control requirements. Figure 9a clearly shows that considering only the cost of the powertrain, but once the battery cost is taken into account, as shown in Figure 9b, this difference cancels out, showing that the efficiency advantage of the two-speed transmission can effectively realize the return on capital.
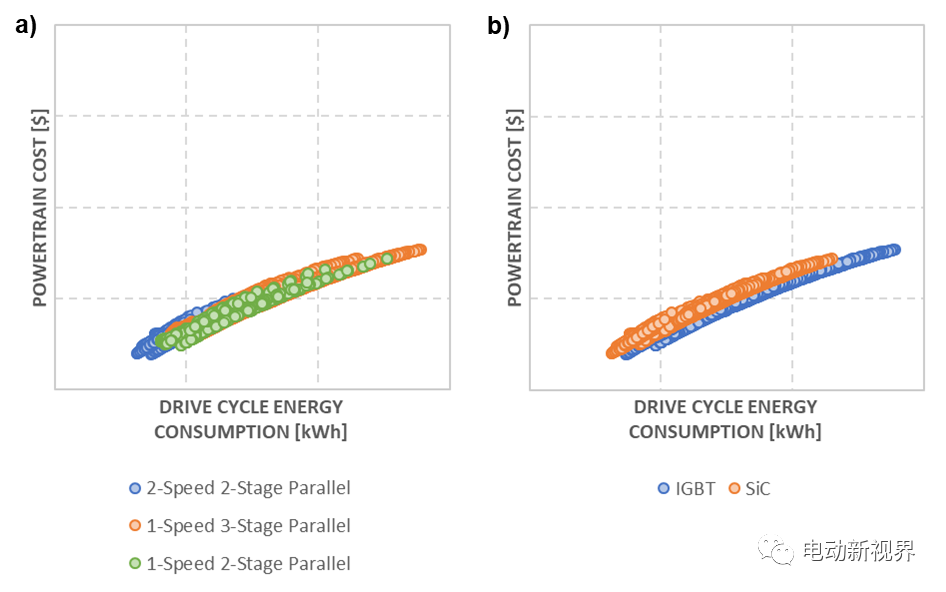
Figure 10 - Energy consumption of automobiles under cycle conditions and 2035 Comparison of estimated annual power costs (including batteries); a) other variable speed designs, b) other inverter designs
At this stage, only the cost of powertrain and batteries is considered from a typical model. However, decisions are made today about products that will be produced in the next few years, and product strategy decisions may inform investment decisions that illuminate longer-term technology choices (such as production line investments). Figures 10a and 10b consider the impact of cost changes on the two previously explored areas of study—frequency converters and transmissions.
As shown in Figure 2a, APC predicts that by 2035, the cost of batteries will be reduced by more than 60% compared to 2017, while the cost of frequency converters will also be reduced by about 40%[2]. It can be expected that while the current option to use SiC inverters is more costly than IGBTs, this cost difference will narrow as the technology becomes more widely adopted.
The results in Figure 10 show that the impact of battery cost has been greatly reduced, and the difference between different frequency converters has gradually narrowed accordingly. This could lead to another interpretation of people's data and thus another kind of decision-making. For example, Figure 10a shows that the efficiency benefit of the two-speed transmission is no longer significant, so the difference with other single-speed transmissions has also been greatly reduced. In this example, a single vehicle application has been considered, but when multiple vehicles or platforms are considered, the decision to use a single speed transmission may be more attractive. The results in Fig. 10b show that the cost difference between SiC and IGBT is already very small. This analysis can be used in conjunction with current technology assessments to gauge the potential of new technologies at current costs and when investments will yield long-term benefits.
Another area to consider is the impact of magnet cost. Figure 2b shows the fluctuating change in the cost of neodymium since 2009, the impact of which must be considered as a major factor affecting the cost of many automotive engines. Figure 11a shows vehicle cycle energy consumption versus powertrain cost (excluding batteries) using current typical magnet costs. Figure 11b shows the same results, but calculated using peak neodymium costs in 2011 instead of magnet costs.
This causes cost variations for the two powertrain configurations of the permanent magnet motor. Induction motors without magnets are not affected. As shown in Figure 11a, powertrains using induction motors typically have the higher cost of each type of frequency converter discussed above. One reason for this is the need to increase phase currents in order to meet performance requirements within an acceptable package volume. However, this increased phase current leads to an increase in the cost of the frequency converter. So while a motor without magnets costs less, the net effect is an increase in cost.
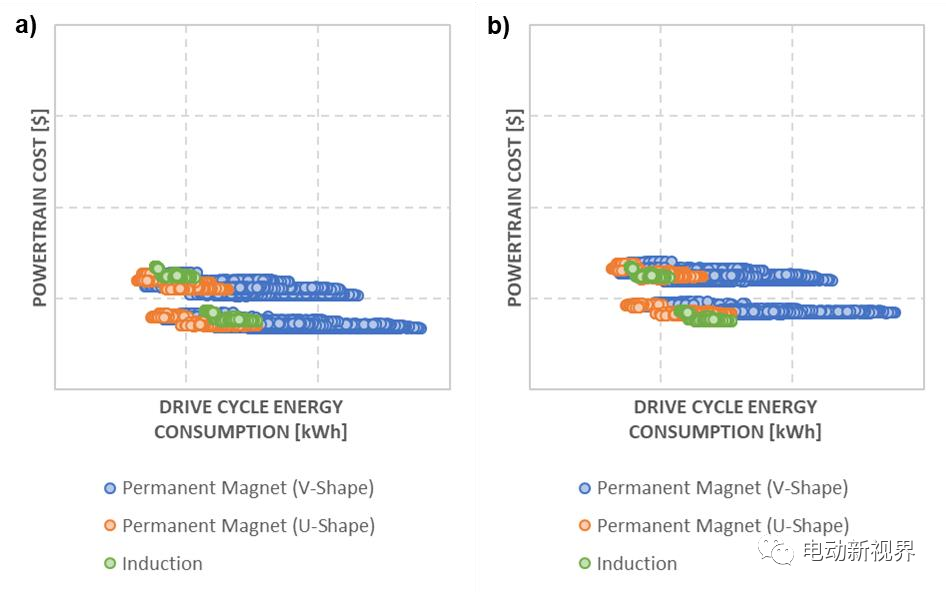
Figure 11 - Energy consumption and power of automobile cycle conditions Cost (excluding batteries); a) current magnet cost, b) peak magnet cost in 2011
If 2011 Neodymium cost peak follows Figure 11b, this trend will change. The higher the cost of the magnet, the higher the cost of the permanent magnet power system. Now, induction motor based variants can be found at the cost end of frequency converters.
This characteristic behavior is further demonstrated in Figure 12 (including the effect of battery cost). Figure 12a uses cost data representative of typical costs for powertrains and batteries today. In this case, permanent magnet motor-based powertrains outperform induction motors in terms of energy consumption and cost, despite strong competition. Figure 12b presents a scenario similar to the one discussed above, where by 2035 the cost of both batteries and frequency converters will be substantially reduced. However, as shown in Figure 11, in this case magnet costs have increased to the same cost peak as in 2011.
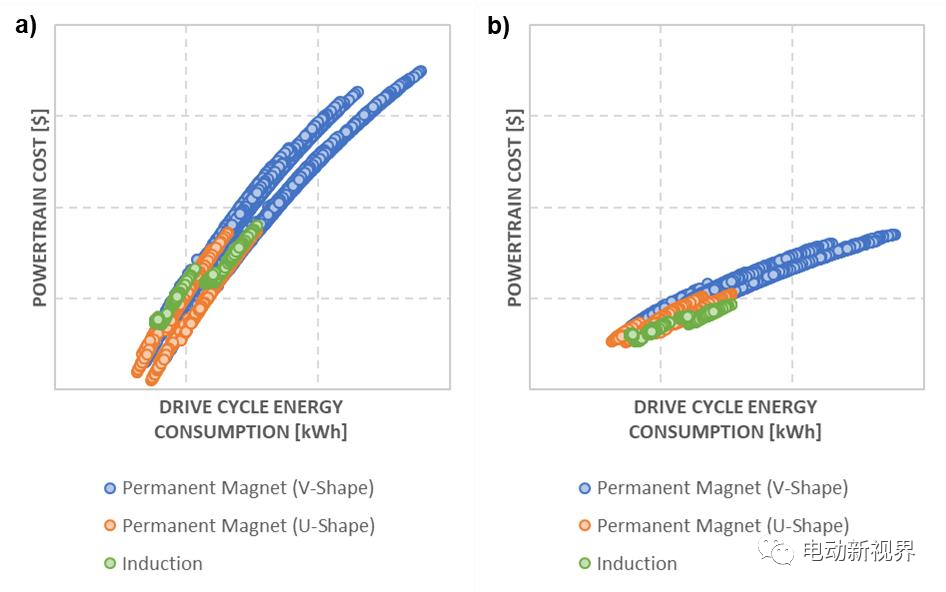
Figure 12 - Energy consumption and power of automobile cycle conditions Costs (including batteries); a) current costs, b) battery and frequency inverter costs expected to peak in 2011 in 2035
Battery costs are expected to decline by 2035, which will reduce the increase The relative impact of efficiency on total cost, bridging the difference between permanent magnet and induction motor based powertrains. Likewise, as the cost of frequency converters decreases, the impact of using higher currents for induction motors decreases. Combined with the magnet cost peak in 2011, we can see a completely different trend in Figure 12b. The difference in energy consumption and cost between the most efficient permanent magnet powertrains and induction motor powertrains becomes small, suggesting that induction motor powertrains will play a large role in developing electrified powertrain strategies in the future.
Conclusion
Hybrid electric vehicle and pure electric vehicle technologies are diverse and developing rapidly. Therefore, manufacturers and suppliers face enormous challenges in formulating product strategies in such a fast-growing industry. Product strategy decisions made now will ultimately affect large-scale investments in manufacturing focused on specific technologies in the coming years. The more decision-making data available to manufacturers, the better. In order to develop a robust product strategy, these decisions should take full account of current and future market conditions.
DSD's ePOP systems approach helps powertrain product concepts be evaluated in this way and their future impact can be determined. The cost of batteries has a huge impact on system cost in today's market, providing significant value for efficiency-enhancing technologies such as SiC inverters, multi-speed transmissions and permanent magnet motors. However, technologies that are popular today may not still be the most powerful solutions in the future.
If projected battery cost trajectories are to be believed, it can be predicted that the relative value of high-efficiency technologies will decrease over the next 10 to 20 years. However, this is based on the assumption that the range of current cars will not increase. If such expectations continue to grow, battery cost will remain a major factor, as the expense of increased range will offset the potential cost per kWh, while efficiency-enhancing technologies will remain valuable.
A systems approach such as ePOP can take into account the overall impact of these developments and conduct an analysis of potential trade-offs. This article also presents several other examples illustrating the potential value of this approach. Although efficiency-enhancing technologies such as SiC inverters, multi-speed transmissions or permanent magnet motors have proven beneficial, the value of choosing the right overall powertrain concept for a vehicle application is critical. Selecting any subsystem or component level that is relevant can increase efficiency and reduce potential costs.
Copyright by Dr. Michael Bryant and Drive System Design (DSD) Inc.